
OVERVIEW OF POLLUTANTS IN HOMES THAT HAVE BEEN MEASURED
Hundreds of chemicals and pollutants have been measured in the indoor residential environment. The goal of this section is to summarize existing data on what pollutants are present in homes and their concentrations.
DATA ON CONCENTRATIONS OF POLLUTANTS IN HOMES
Sleeping and exposure
Exposures in homes constitute the major part of exposures to airborne pollutants experienced through the human lifetime. They can constitute from 60 to 95% of our total lifetime exposures, of which 30% occurs when we sleep. Exposures can be modified by controlling sources of pollutants, their local removal or trapping at the point of release, general ventilation with unpolluted air, and filtration and air cleaning. Short-term and long-term exposures to airborne pollutants indoors can create risks for acute health problems such as irritation or aggravation of asthma and allergy symptoms, for chronic diseases such cardiovascular and respiratory problems, and can elevate risk for premature death. There are numerous nonairborne pollutants in the indoor environment, such as phthalates in settled dust and endocrine disrupters in sunscreen, however since these are not impacted by ventilation standards, they will not be covered in this Technote.
Indoor / outdoor
Exposures in homes have different origins. The airborne pollutants constituting these exposures have sources outdoors and indoors. Pollutants having sources outdoors penetrate building envelope through cracks, gaps, slots and leaks, as well as through open windows and ventilation systems. Exposures to these pollutants also occurs outdoors but have much shorter durations than the exposures indoors due to human activity patterns (Klepeis et al. 2001). There are numerous indoor pollutant sources as well. Indoor pollutant sources can emit constantly, episodically, and periodically. Sources include home furnishings and products, human activities, and indoor combustion. Exposures to these pollutant sources only occur indoors.
Outdoor pollutant sources
The main sources of pollutants having outdoor origin include combustion of fuels, traffic, atmospheric transformations, and vegetation activities of plants. The examples of pollutants that are emitted because of these processes include particulate matter, including pollens; nitrogen oxides; organic compounds such as toluene, benzene, xylenes and polycyclic aromatic hydrocarbons; and ozone and its products. A specific example of a pollutant having outdoor origin is radon, a natural radioactive gas emitted from some soils that penetrates building structure through cracks in the envelope and other openings. The risk of exposure to radon is location-dependent condition to the geological structure of the site where the building is constructed. Radon mitigation will not be discussed in the body of the present TechNote. Methods for radon mitigation, independent of ventilation standards, have been thoroughly investigated elsewhere (ASTM 2007, WHO 2009). The main sources of pollutants having indoor origin include humans (e.g. bioeffluents) and their activities related with hygiene (e.g. aerosol product use), house cleaning (e.g. uses of chlorinated and other cleaning products), food preparation (e.g. cooking particle emissions), etc.; building construction materials including furnishings and decoration materials (e.g. formaldehyde emissions from furnishings); tobacco smoking and combustion processes occurring indoors, as well as pets (e.g. allergens). Mishandling of installations such as improperly maintained ventilation or heating systems can also become important sources of pollutants having origin indoors.
Indoor pollutant sources
The pollutants measured in homes are summarized in the following to identify those that have been ubiquitous, and those having the highest measured mean and peak concentrations. Two indicators describing the pollution level are used to address both chronic and acute exposures. In most of the cases the measured data is weighted by number of measurements which in many cases is in number of homes. The selection is based on the data reported by Logue et al. (2011a) who reviewed 79 reports and compiled database including summary statistics for each pollutant reported in these reports. The data of Logue was compared with the few reports published later (Klepeis et al. 2001; Langer et al. 2010; Beko et al. 2013; Langer and Beko 2013; Derbez et al. 2014; Langer and Beko 2015).
DATA ON THE PREVALENCE OF MOULD/MOISTURE
Certain conditions indoors, e.g. excessive humidity levels which are impacted by ventilation, can also lead to mould development which may emit pollutants including organic compounds, particulate matter, allergens, fungi and moulds, and other biological pollutants, contagious species and pathogens. The moisture content in the air (relative humidity) is an important agent modifying our exposures in homes. The moisture is not and should not be considered as a pollutant. However, too high or too low levels of humidity can modify exposures and/or can initiate processes that can lead to elevated exposures levels. This is why humidity should be considered in the context of exposures in homes and health. Humans and their activities indoors are usually main sources of moisture indoors unless there are any major construction flaws causing leaks or penetration of moisture from ambient air. Moisture can be also brought indoors by infiltrating air or through dedicated ventilation systems
LIMITED INFORMATION ON AIRBORNE POLLUTANT CONCENTRATIONS
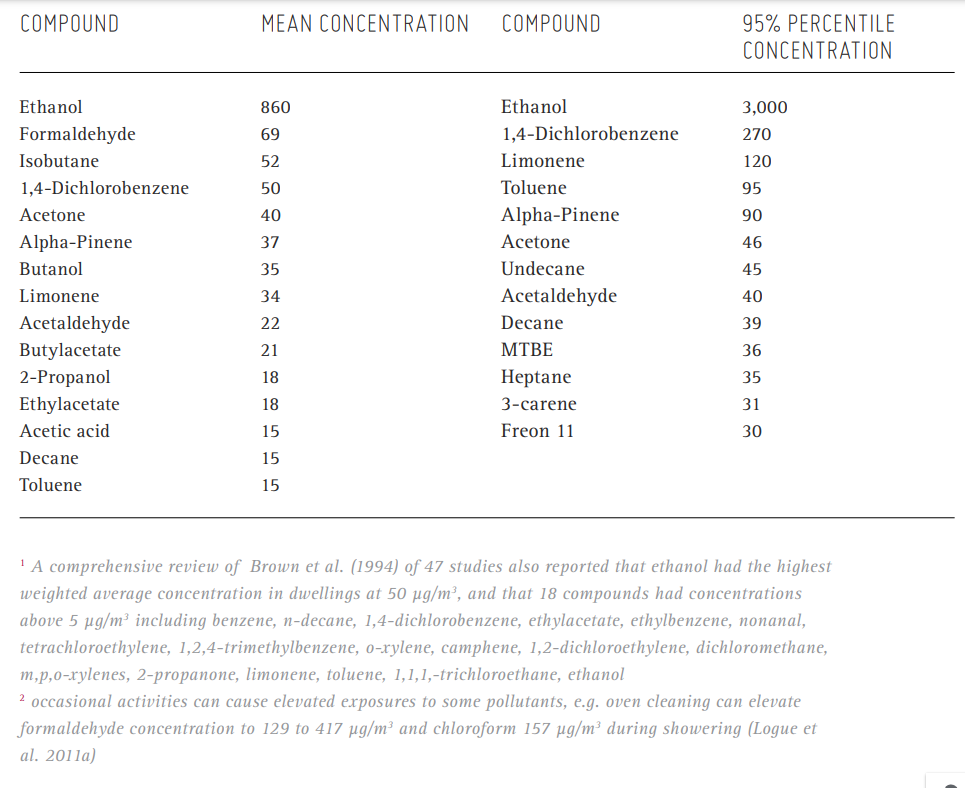
Several studies have measured indoor concentrations of airborne pollutants in residences. The most prevalently measured volatile organic compounds [grouped and ordered by number of studies in the descending order] were: [toluene], [benzene], [ethylbenzene, m,p-xylenes], [formaldehyde, styrene], [1,4-dichlorobenzene], [o-xylene], [alpha-pinene, chloroform, tetrachloroethene, trichloroethene], [d-limonene, acetaldehyde], [1,2,4-trimethylbenzene, methylene chloride], [1,3-butadiene, decane] and [acetone, Methyl tert-butyl ether]. Table 1 shows the selection of volatile organic compounds from Logue et al (2011), a study that aggregated data from 77 studies that measured airborne non-biological pollutants in homes in industrialized nations. Table 1 reports the weighted-mean concentration and 95th percentile concentration from available studies for each pollutant. These levels can be compared with the measured concentration of total volatile organic compounds (TVOCs) sometimes reported by the studies performing measurements in buildings. Recent reports from Swedish building stock show mean TVOC levels at 140 to 270 μg/m3 (Langer and Becko 2013). The potential sources of ubiquitous volatile organic compounds and the compounds with the highest concentration are presented in Table 4.
Table 1: VOCs measured in residential environments with the highest mean and 95th percentile concentration in μg/m³ (data from Logue et al., 2011)1,2
The most prevalent semi-volatile organic compounds (SVOCs) [grouped and ordered by number of studies in the descending order] were: naphthalene; pentabromodiphenylethers (PBDEs) including PBDE100, PBDE99, and PBDE47; BDE 28; BDE 66; benzo(a)pyrene, and indeno(1,2,3,cd)pyrene. There are also numerous other SVOCs measured including phthalate esters and polycyclic aromatic hydrocarbons. but because of the complicated analytical requirements they are not always measured and thus reported only occasionally. Table 2 shows the selection of semi-volatile organic compounds with the measurement weighted mean concentration from all available studies and with the highest top-of-range concentration together with the reported concentration level. It can be observed that the concentrations are at least one order of magnitude lower than in case of VOCs. The potential sources of common semi-volatile organic compounds and the compounds with the highest concentration are presented in Table 4.
Table 2: SVOCs measured in residential environments with the highest mean and top-of-range(highest measured) concentration in μg/m3 (data from Logue et al., 2011)1,2
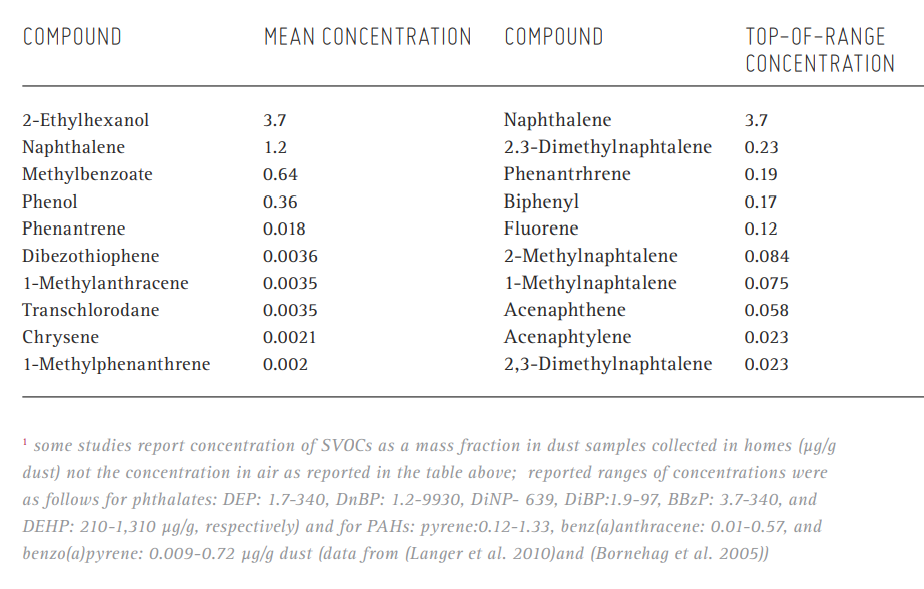
Table 3 shows the concentrations and 95th percentile for other pollutants including carbon monoxide (CO), nitrogen oxides (NOx), and particular matter (PM) having size fraction lower than 2.5 μm (PM2.5) and ultrafine particles (UFP) with the size lower that 0.1 μm, as well as sulphur hexafluoride (SO2) and ozone (O3). Potential sources of these pollutants are given in Table 4.
Table 3: Concentration of selected pollutants measured in residential environments in μg/m3 (data from Logue et al. (2011a) and Beko et al. (2013))1,2,3
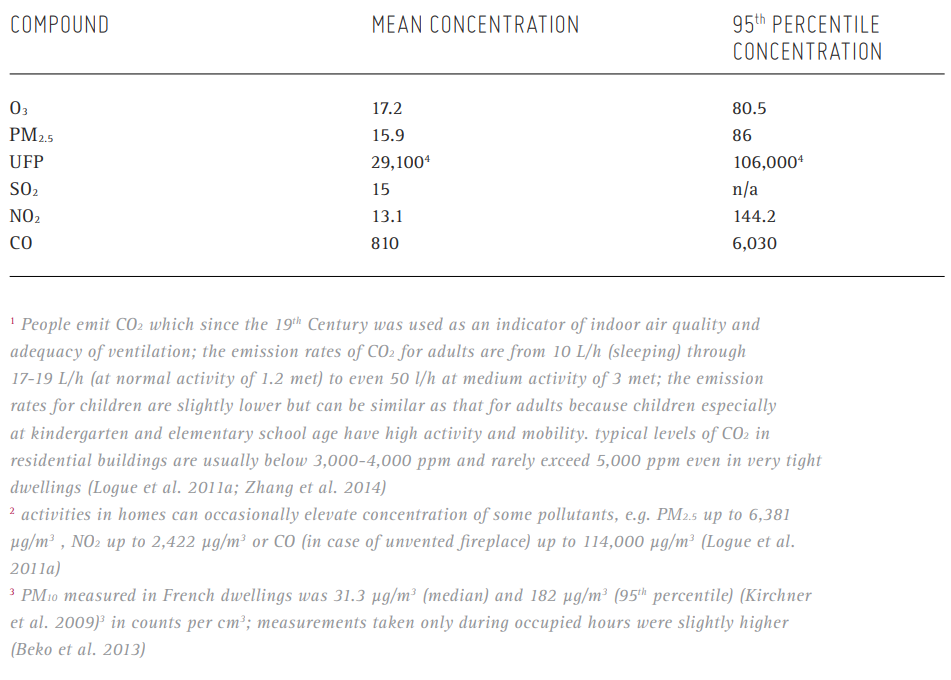
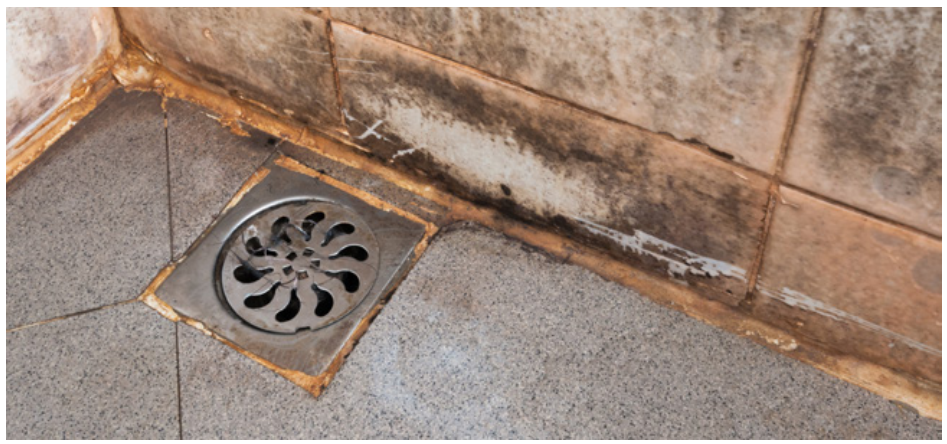
Figure 2: Mould in a bathroom
Biological pollutants sources
There have been numerous biological pollutants measured in homes especially in studies of mould and moisture in homes associated with fungal proliferation and bacteria activity as well as release of allergens and mycotoxins. Examples include Candida, Aspergillus, Pennicillum, ergosterol, endotoxins, 1-3β–d glucans. Presence of pets or proliferation of house dust mites can also result in elevated levels of allergens. Typical indoor concentrations of fungi in homes in US, UK and Australia have been seen to range from 102 to 103 colony forming units (CFU) per m3 and as high as 103 to 105 CFU/m3 in particularly moisture damaged environments (McLaughlin 2013). The measured median levels of dog allergens (Can f 1) and cat allergens (Fel d 1) in French houses were below limit of quantification respectively 1.02 ng/m3 and 0.18 ng/m3 whereas 95% percentile concentration was 1.6 ng/m3 and 2.7 ng/m3 respectively (Kirchner et al. 2009). Mite allergens in mattress measured in 567 dwellings in France were 2.2 μg/g and 1.6 μg/g for Der f 1 and Der p 1 allergens respectively, while the corresponding 95% percentile levels were 83.6 μg/g and 32.6 μg/g (Kirchner et al. 2009). Table 4 shows the major sources associated with selected pollutants listed above. A distinction is made, if possible, whether the sources are located indoors or outdoors. It is clear that the pollutants in dwellings originate from many sources and it would be quite challenging to identify one or two sources being mainly responsible for elevated exposures
Table 4: Major pollutants in dwellings with the associated sources of their origin; (O) indicates sources present outdoors and (I) sources present indoors

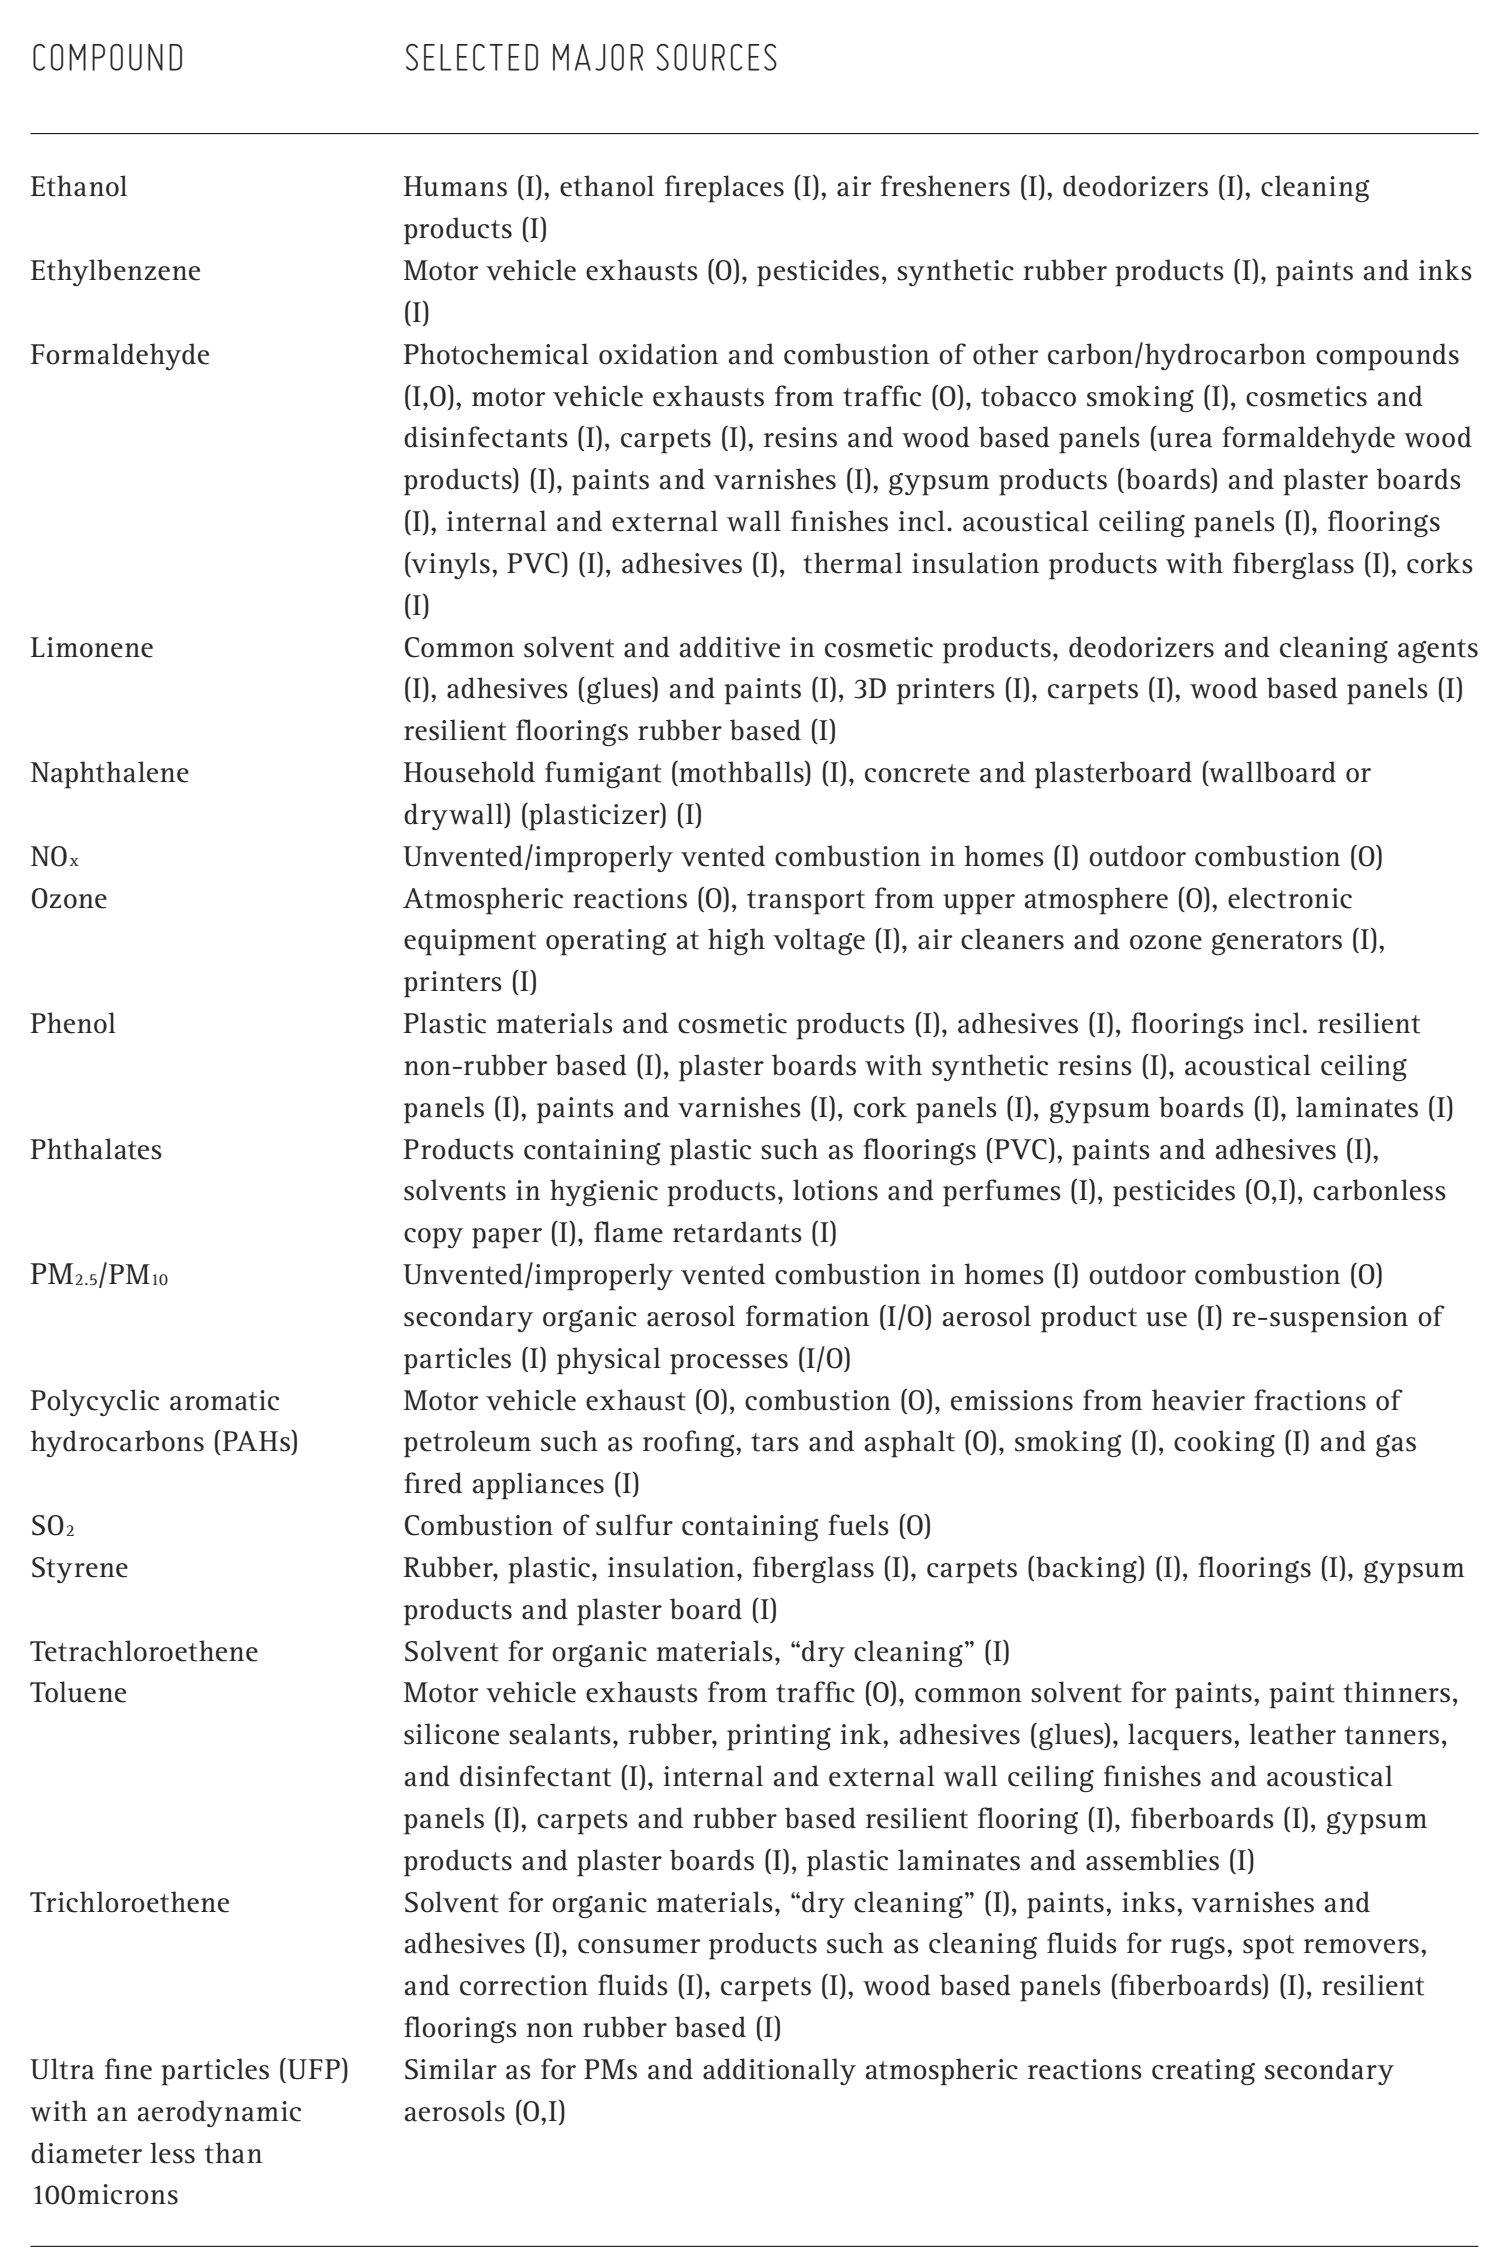

Figure 3: Paint can be a source of different pollutants
Post time: Sep-17-2021